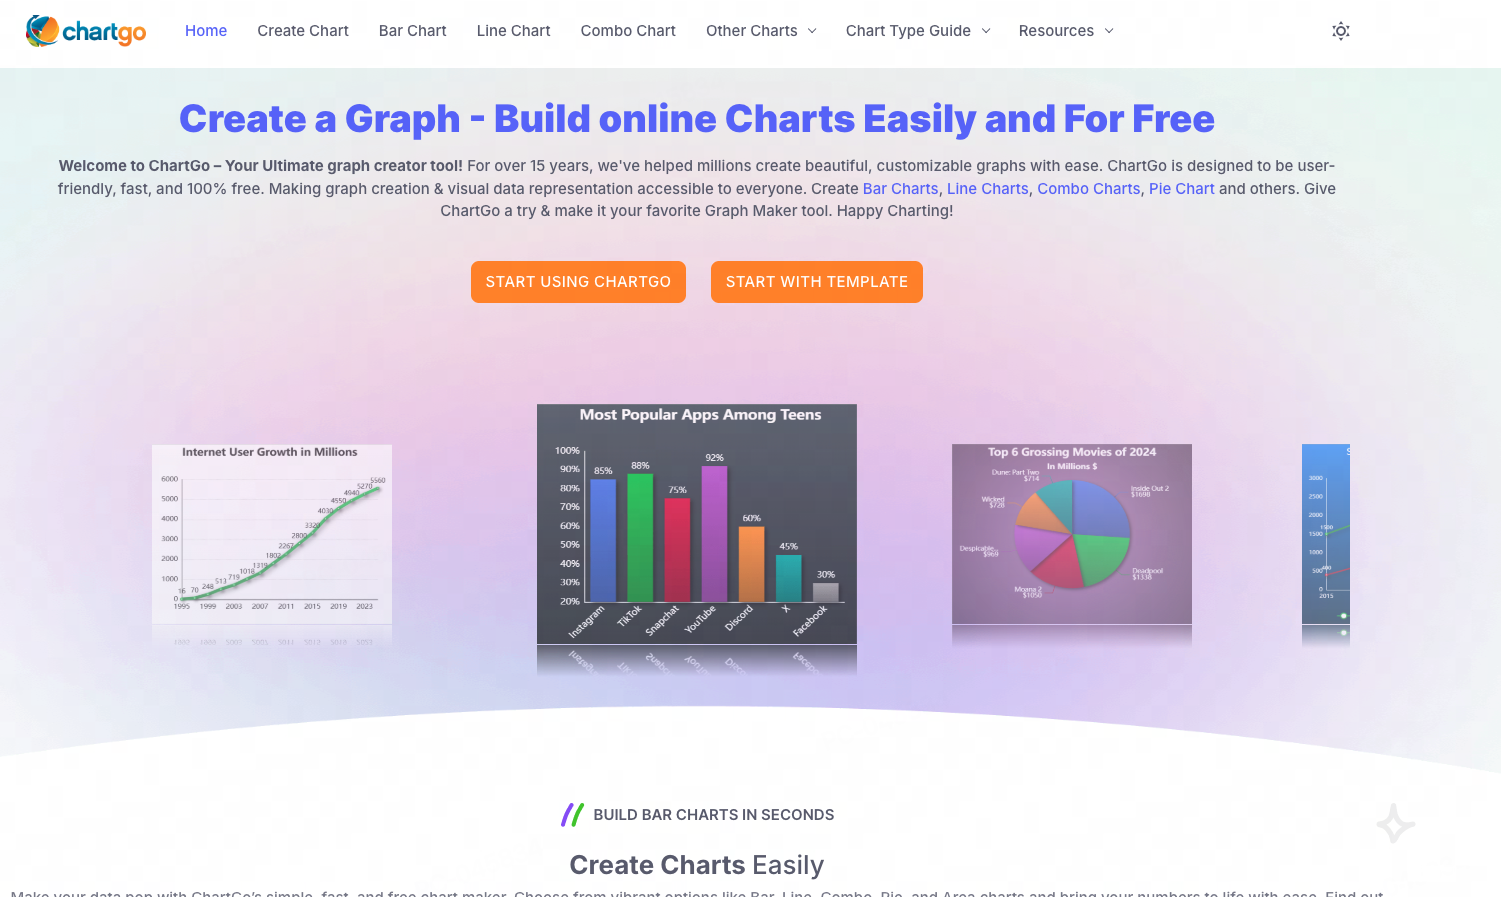
ChartGo Review 2026: Free Online Chart Maker
Review ChartGo for 2026: a free online chart maker with no sign-up. Compare bar, line, and pie charts, export options, and when to use it vs other tools.
May 22, 202613 min read
Read MoreTutorials and practical notes on charts, data visualization, and using BeCharts effectively.
Review ChartGo for 2026: a free online chart maker with no sign-up. Compare bar, line, and pie charts, export options, and when to use it vs other tools.
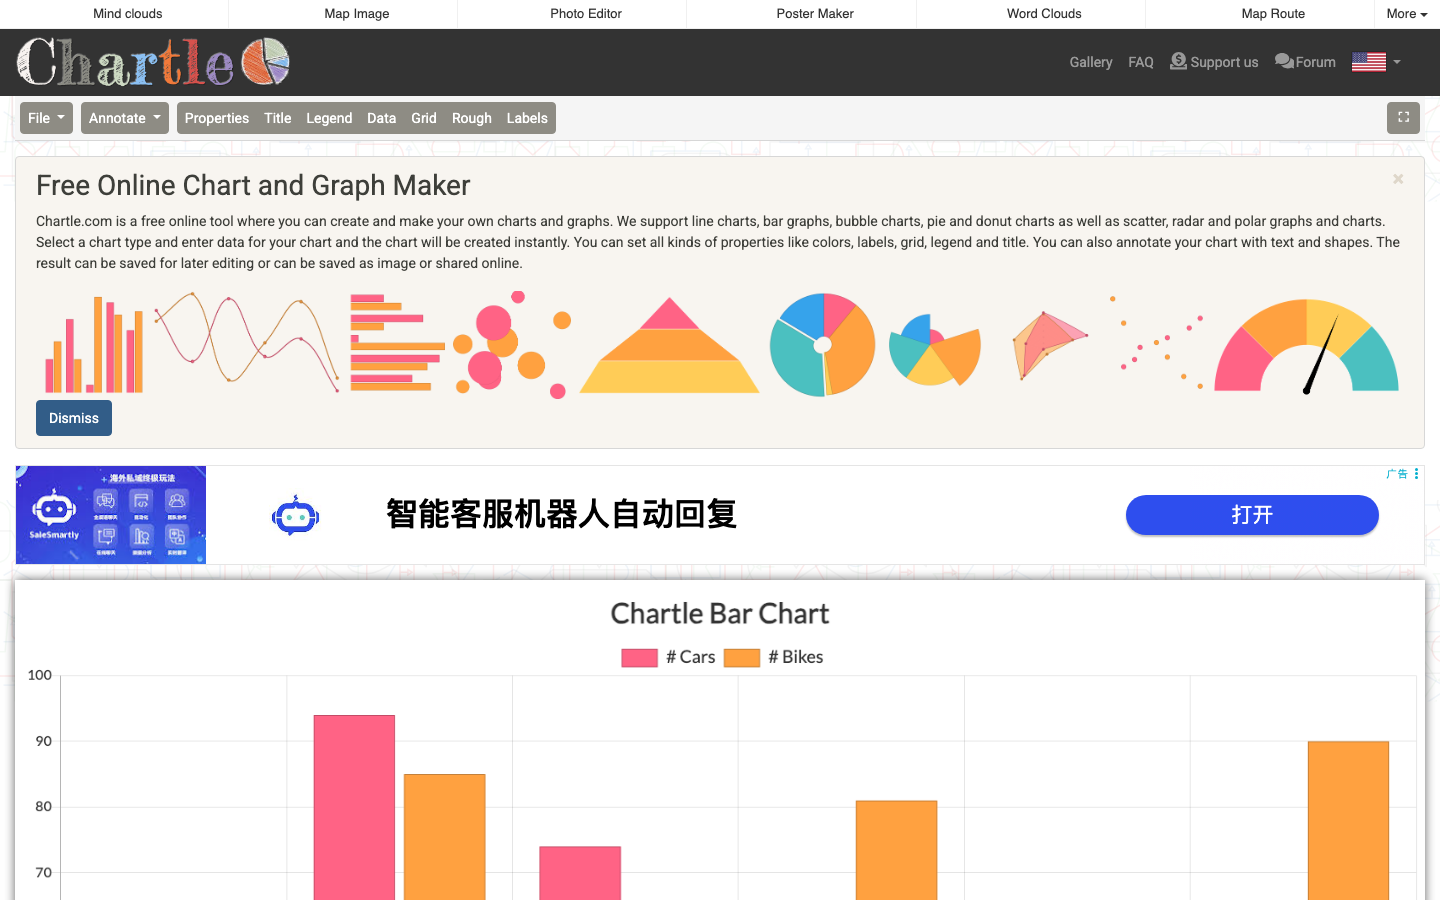
Review Chartle for 2026: free x and y graph maker, online line chart maker, PNG graph export, and local privacy. Compare ChartGo, column charts, and radial graphs.
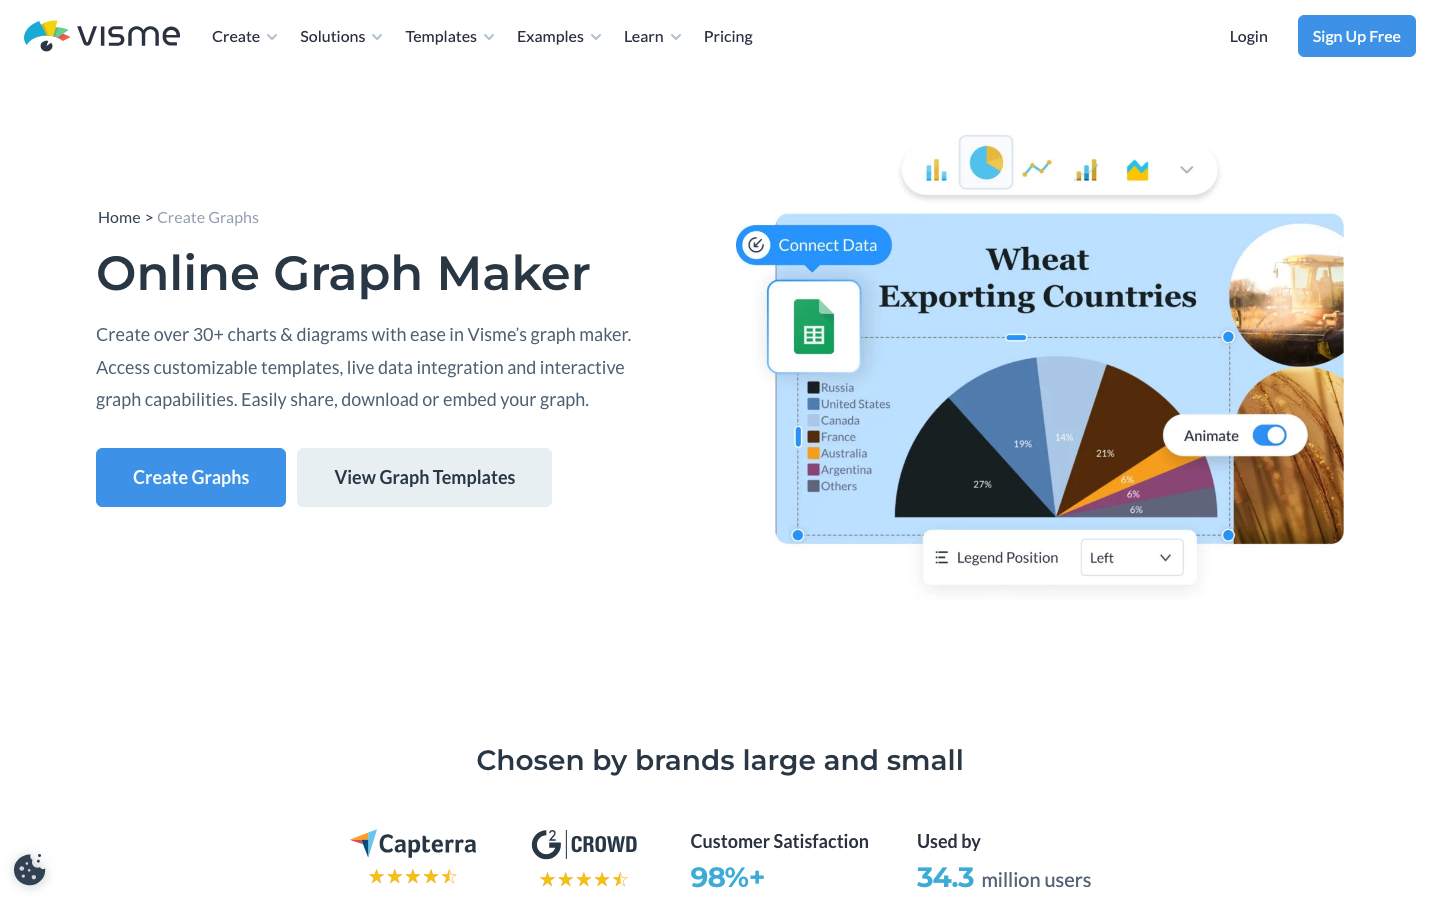
Review Visme as a column chart maker, dot plot creator, and economics graph maker. Compare Google Sheets bar charts, mosaic plots, and lighter tools like Graphfree.
In-depth review of epiLocal Free Chart Maker. Learn how this free tool helps you quickly generate publishable column charts, pie charts, and statistics charts.

In-depth review of Highcharts for 2026. Explore how this powerful JavaScript charting library builds interactive dashboards, maps, Gantt timelines, and specialized charts.
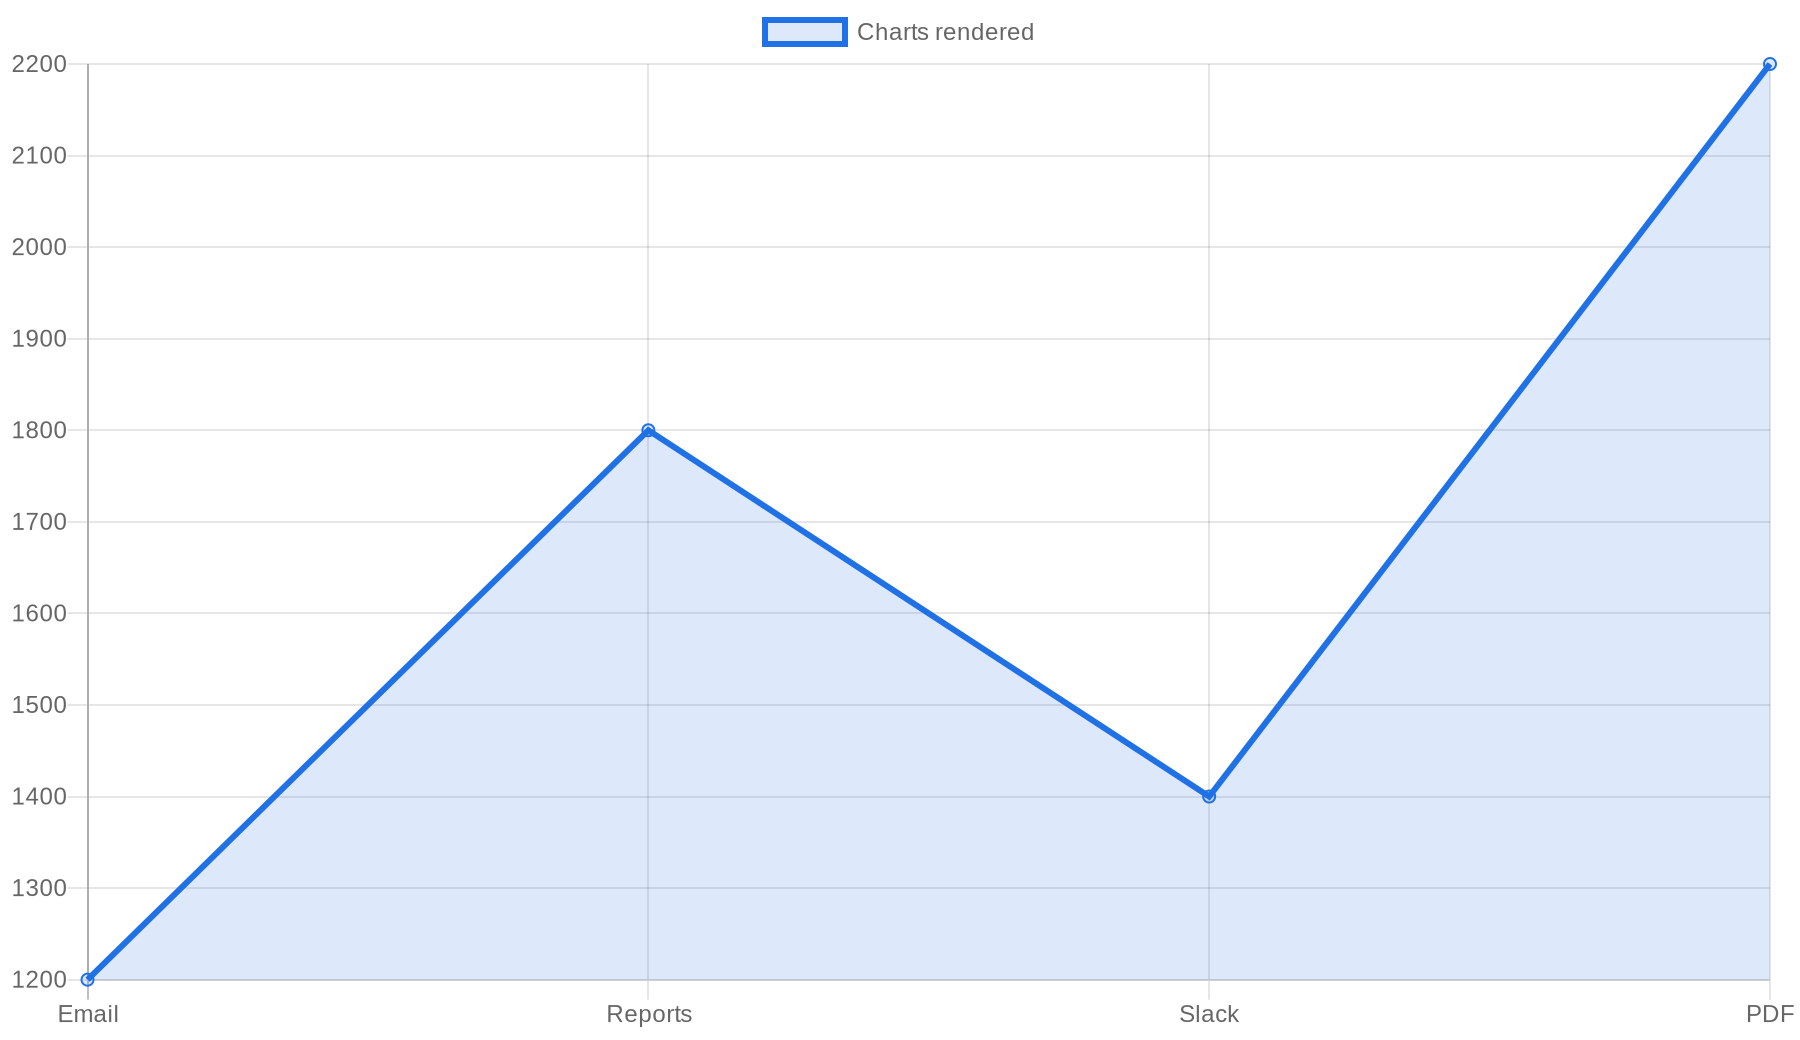
Review QuickChart for 2026: Chart.js chart image API for email and PDFs, PNG/SVG export, plus QR code API for bulk, vCard, and spreadsheet workflows.
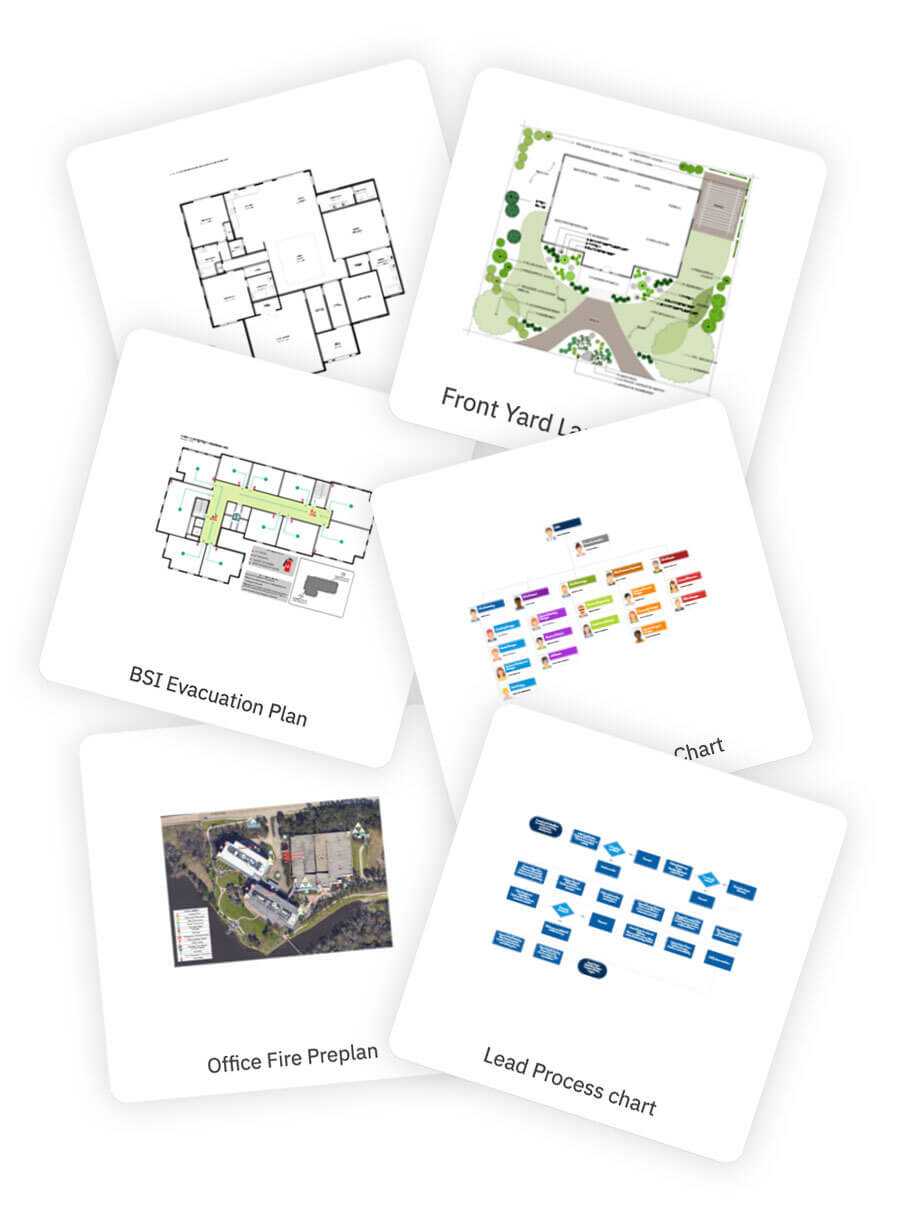
In-depth SmartDraw review for 2026. Learn if this professional diagramming software for flowcharts, site plans, planograms, and floor plans is right for your team.
Learn what a pie chart is, when to use one, common pie chart types, examples, advantages, limitations, and best practices for clear data visualization.
Learn what a bar chart is, when to use one, common bar chart types, examples, advantages, limitations, and best practices for data visualization.
Learn what a line chart is, when to use one, common types, examples, and best practices for creating clear line graphs for data visualization.
A practical guide to matching your data and message to the right chart. Learn when to use line, bar, pie, and more.